Introduction
This is a computer vision and deep learning project that I did for my Machine Vision course as part of my Masters degree in Data Science. I was particularly excited by both the advances in deep learning and the increased accessibility of large-scale, high resolution satellite image datasets. The practical applications of successful building extraction from satellite images are far ranging and include many humanitarian applications such as population estimation, governance and city planning, planning vaccine distribution, and targeting financial aid and development resources [1] [2] [3]. The challenges facing the discipline are equally grand, and include the analysis of off-nadir imagery, accounting for seasonal variation in land cover, the diversity of building materials, size, and structure, and much more. In an attempt to close the gap between the recent advances made in deep computer vision models with the real-world applications of satellite image analysis, the organization, SpaceNet, conducts regular competitions for various urban feature extraction tasks using high quality commercial satellite data. In particular, the SpaceNet2 Challenge in 2017 made available a set of lightly preprocessed datasets covering four geographical locations for the task of building extraction. In this project, I use one of these datasets to train a U-net deep neural network to evaluate the model’s performance for building extraction.
Dataset
This training dataset contains 8-band orthophoto data over Khartoum, Sudan. Developing regions pose some unique challenges to building extraction. Buildings in developing regions are extremely diverse in appearance and building material, are often spaced in irregular intervals, and can be very closely packed together. Additionally, this dataset contains annotations for many sheds and small structures as buildings, which can greatly weight the performance of certain evaluation metrics. This data set covers 765 square kilometers and contains over 35,000 building annotations on both urban and rural land.
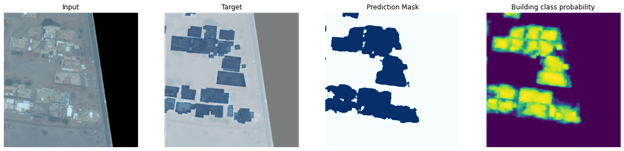
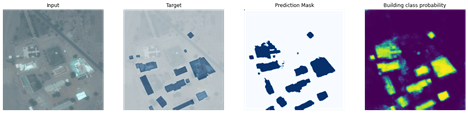
As part of preprocessing, I extracted the red, green, and blue bands from each pan-sharpened image in the dataset. These pan-sharpened color images have a resolution on the ground of 30 cm, which is enables the identification of such small buildings. Additionally, the data set has complete coverage of the area of interest with no significant overlap in imaging and 0% cloud cover.
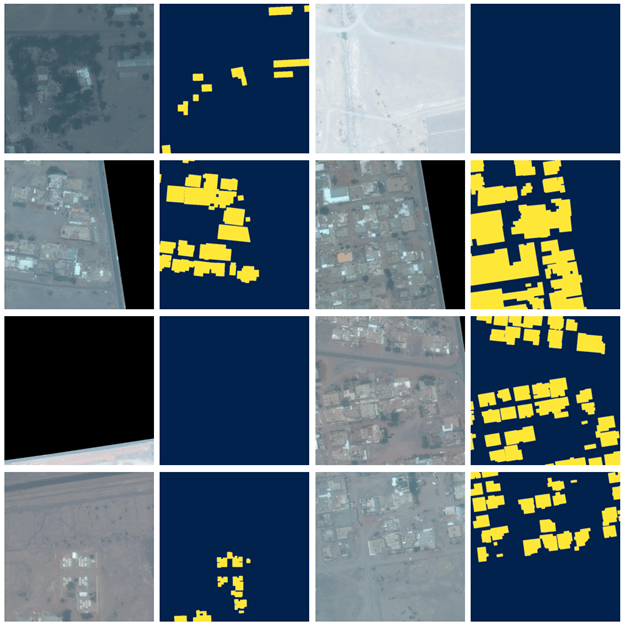
The yellow and black images are the building annotations for the corresponding satellite images. The images look a bit washed out because I extracted only 3 of the 8 color channels from the original satellite image. As part of preprocessing, I applied histogram localization with a kernel size of 50 pixels to increase the contrast of these images which had a marginal improvement on performance, but I suspect I could have improved performance even more by using all available color channels.
The images above also illustrate the diversity of roof types and building size that developing regions often contain. As I’ve mentioned, this is one of the core challenges for automatic building extraction in these regions.
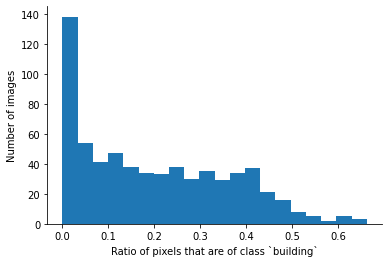
You’ll also notice in the images above that some satellite images contain no buildings at all, either because much of the image was cropped out due to the licensing of the dataset or because the image is of rural land that truly contains no buildings. By plotting the histogram of the percentage of the image that is annotated as a “building”, we can see that the dataset as a whole is largely imbalanced and has almost 140 of the 933 images (15%) in the dataset contain no buildings at all.
Methods
The standard method for building extraction is image segmentation, for which I used the popular U-net architecture with a pretrained ResNet34 encoder to utilize transfer learning from the ImageNet dataset. U-net was initially designed for image segmentation of cells in biomedical imagery in 2015 and its numerous variants have since become common for image segmentation tasks due to its intuitive architecture and high performance. During training, I allowed further fine-tune the ResNet34 model’s weights by slicing the learning rates between the encoder and decoder to avoid degrading the pre-trained weights significantly while also training the encoder for our specific detection task of satellite images. Because the dataset is relatively small (only 744 images in the training set), I used data augmentation to prevent overfitting (satellite imagery is the prime use-case for data augmentation). This includes flipping the training image (and annotation mask) vertically or horizontally, rotating 90 or 180 degrees, and increasing or decreasing the brightness, contrast, and saturation by 20 percent, each with a 50 percent probability. Furthermore, images without buildings were removed from the training set to combat the class imbalance in our dataset. Batch normalization was applied to training batches to reduce overfitting as well.
To generate the training annotations images (which are shown above in yellow), the polygon coordinates of buildings, which were originally stored as geojson files, were projected into their corresponding image’s pixel space using the Affine transformation parameters stored in the metadata of the corresponding image. The borders and interior space of these polygons were given a value of 255 while the background was given a pixel value of 0.
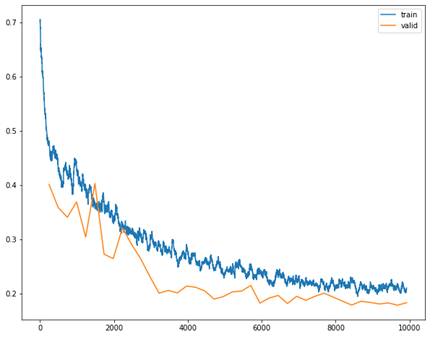
Using these target binary maps for training, the model U-net produced prediction maps of the same dimension as the input image (650×650) with pixel values representing probabilities between 0 and 1. The image below shows the learning curve on the test and training datasets (using a 80/20 split because this dataset is so small). Again, the data augmentation greatly improve learning for this task, allowing the model to train for longer without converging after only a few iterations. The x-axis in the image below is batch iterations. The model only trained on the dataset for 40 iterations before reaching convergence.
After training, the model was then evaluated on the validation set to produce prediction maps (examples shown below). With a threshold of 0.5, these prediction maps could be used for building footprint detection to achieve an F1-score of 0.801 (note that this accuracy metric is on a per-pixel basis)


With these promising results, I then attempted to use these prediction maps for building detection (per-building identification rather than per-pixel identification). ImageNet, the large-scale image recognition competition, has a clear definition of what is considered adequate “detection” of an object. I developed a post-processing pipeline to evaluate these U-net prediction maps using ImageNet’s definition of building detection.
This post-processing pipeline including the following. I applied a gaussian blur to smooth the prediction map, rescaled the image to future reduce noise, used a threshold of 0.5 to obtain the image segmentation, removed small connected-components with areas below 50 pixels, and then used a greedy algorithm to create building segments in the order of highest confidence to least confident prediction probability. After these post-processing steps, I implemented ImageNet’s Algorithm #2 for object detection from segmentation which requires that a segmentation has an Intersection over Union above 0.5 with the binary target image for a building to be classified as adequately detected [11]. Unfortunately, after all this work, the building detection algorithm only achieved an F1-score of 0.201, much worse than the per-pixel evaluation.
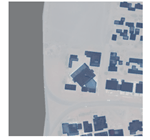
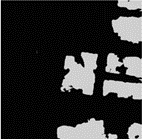
This was largely caused by the fact that the model had difficulty separating closely spaced buildings, with small buildings especially difficult to distinguish. This causes the model to group closely spaced buildings into single, large “buildings”, which results in a relatively high per-pixel F1-score while driving down the per-building F1-score significantly. The image below illustrates this point. In particular, in the upper right and bottom of the target map (left), there are groups of several buildings that the model fails to separate in the ultimate image segmentation (right).
Conclusion
To review, I used a deep neural network that was originally developed for analyzing biomedical images of cells in in petri dish to identify building footprints from orthophoto satellite images of Khartoum, Sudan. The algorithm achieved a reasonable F1-score of 0.801 on footprint detection by segmentation despite the many limitations of the dataset (primarily the small size and low contrast) and the challenges of building detection in developing countries (informal and diverse building structures and materials as well as buildings at irregular spacing). At the end of the project, there were still many limitations to the performance of the model that I developed, particularly when it came to building detection and separating small, closely spaced buildings. I’m going to present a thorough evaluation of this model in a later post. I spent a lot of time reading and thinking about how to improve the poor performance on building detection, and I think I found some promising paths forward. I will be presenting these potential improvements in a future post as well.
References
- Brian Abelson, Kush R. Varshney, and Joy Sun. 2014. Targeting Direct Cash Transfers to the Extremely Poor. InProceedings of the 20th ACM SIGKDD International Conference on Knowledge Discovery and Data Mining (New York, New York, USA) (KDD ’14). Association for Computing Machinery, New York, NY, USA, 1563–1572. https://doi.org/10.1145/2623330.2623335
- Nita Bharti, Ali Djibo, Andrew J. Tatem, Bryan T. Grenfell, and Matthew J. Ferrari. 2016. Measuring populations to improve vaccination coverage.Scientific Reports 5 (5 Oct. 2016). https://doi.org/10.1038/srep34541
- Tobias G. Tiecke, Xianming Liu, Amy Zhang, Andreas Gros, Nan Li, Gregory Yetman, Talip Kilic, Siobhan Murray, Brian Blankespoor, Espen B. Prydz, and Hai-Anh H. Dang. 2017. Mapping the world population one building at a time. arXiv:1712.05839 [cs.CV]
- Kush Varshney, George Chen, Brian Abelson, Kendall Nowocin, Vivek Sakhrani, Ling Xu, and Brian Spatocco. 2015. Targeting Villages for RuralDevelopment Using Satellite Image Analysis.Big Data 3 (03 2015), 41–53. https://doi.org/10.1089/big.2014.0061
- Vijay Badrinarayanan, Alex Kendall, and Roberto Cipolla. 2016. SegNet: A Deep Convolutional Encoder-Decoder Architecture for Image Segmentation.arXiv:1511.00561 [cs.CV]
- Xianming Liu, Amy Zhang, Tobias Tiecke, Andreas Gros, and Thomas S. Huang. 2016. Feedback Neural Network for Weakly Supervised Geo-SemanticSegmentation. arXiv:1612.02766 [cs.CV]
- Wei Liu, Dragomir Anguelov, Dumitru Erhan, Christian Szegedy, Scott Reed, Cheng-Yang Fu, and Alexander C. Berg. 2016. SSD: Single ShotMultiBox Detector.Lecture Notes in Computer Science(2016). https://doi.org/10.1007/978-3-319-46448-0_2
- Jiangye Yuan. 2016. Automatic Building Extraction in Aerial Scenes Using Convolutional Networks. arXiv:1602.06564 [cs.CV]
- Olaf Ronneberger, Philipp Fischer, and Thomas Brox. 2015.U-Net: Convolutional Networks for Biomedical Image Segmentation.arXiv:1505.04597 [cs.CV]
- Jiangye Yuan. 2016. Automatic Building Extraction in Aerial Scenes Using Convolutional Networks. arXiv:1602.06564 [cs.CV]
- Russakovsky, O., Deng, J., Su, H. et al. ImageNet Large Scale Visual Recognition Challenge. Int J Comput Vis 115, 211–252 (2015). https://doi.org/10.1007/s11263-015-0816-y
- David Lindenbaum, 2nd SpaceNet Competition Winners Code Release. Jul 26, 2017. Last accessed May 13, 2021. https://medium.com/the-downlinq/2nd-spacenet-competition- winners-code-release-c7473eea7c11
- Alvin Prayuda Juniarta Dwiyantoro, Distance-IoU Loss: An Improvement of IoU-based Loss for Object Detection Bounding Box Regression. Jan 8, 2020. Last accessed May 13, 2021. https://medium.com/nodeflux/distance-iou-loss-an-improvement-of-iou-based-loss-for-object-detection-bounding-box-regression-4cbdd23d8660
