
The following paper was written and submitted by a classmate and I to the 2021 UPSTAT Conference data analysis competition.
Introduction
In following the example set by the Austin’s Office of Police Oversight (OPO) annual traffic reports on racial profiling, we aim to assess the present disparities in traffic enforcement and provide recommendation for addressing the limitations of the available data. In this report, we focus our analysis on three strategic aims: 1) assess disparities in arrest, search, citation, and warning rates 2) assess disparities in polices’ use of force and 3) assess disparities in policing as a factor of gentrification. These aims are guided by the available data and are intended to bring attention to disparities in policing in Austin, TX. While no single metric can perfectly gauge the level of fairness in the policing of Austin, each can aid in revealing latent injustices that would otherwise be ignored.
The publicly available datasets generated by the Austin Police Department (APD) offer invaluable insight into the crime figures and subsequent policing within a given area. While the limitations of this data will be discussed in more detail in this report, the Austin City Council and the responsible members should be commended for their commitment to transparency and data-driven innovation.
Data Selection and Preprocessing
We obtained the majority of datasets used in our analysis via the city’s Open Data Portal. The data comprises information from the most recent year in which the data was published. For our analysis of arrest, citations, and warnings, we pulled the 2019 Racial Profiling RP Arrests, 2019 Racial Profiling RP Citations, and 2019 Racial Profiling RP Warnings datasets. These were processed and combined using R. Processing involved editing the time and date features into human-readable values, converting the X and Y coordinates from NAD 1983 HARN StatePlane Texas Central FIPS 4203 to WGS84, and standardizing the features related to race, race known prior to stop, and reasons for stop and search.
Additionally, we pulled the 2019 Response-to-Resistance dataset containing the police records for instances of force from Austin Open Data Portal, and filtered for instances of force that occurred as a result of motor vehicle stops. The data was then standardized in accordance with the racial profiling datasets previously mentioned. The standardization of the subject’s race in this dataset to match those in the racial profiling potentially introduces bias into the data. The subject’s race in this dataset is an APD-reported feature that is intended to follow the race/ethnicity definitions of the US Census Bureau. To obtain the major race categories recorded in the arrest, citation, and warnings datasets of “White”, “Black”, and “Hispanic”, a subject’s ethnicity as Hispanic was used to supersede their race. This approximation of the APD racial categories is not without its limitations, however. According to 2019 population estimates by the US Census Bureau, non-white Hispanics or Latinos comprise 2.64% of the population in Austin and the surrounding cities. The same area has a multi-racial population that accounts for a similar 2.57% of the population. It is not clear from the APD’s racial profiling documentation how they account for multi-ethnic and multi-racial subjects, nor does the documentation contain any procedure as to how racial descriptions are determined by the APD. Inaccuracies such as these can lead to data bias and affect the veracity of decision-making. For this reason, we recommend that the APD standardize its documentation of race and provide clear documentation and training as to how racial descriptions are generated for data collection.
The Austin Police Department General Orders defines “use of force” as any contact that a police officer has with a subject within a single encounter1. For each instance of force in the 2019 Response-to-Resistance dataset, a level of force used by the police is documented as one of four categories. For our analysis, in cases where multiple levels of force were used in a single event, we considered only the most severe level of force. Finally, we obtained historical datasets from the APD records on response-to-resistance instances between 2010-2018, AccountabilityNow.com and prepared in the same manner.
Finally, we referenced population demographic statistics for Austin and the surrounding areas using the 2010 Census Web Portal. Our data pipeline is shown below.

Disparity in Moving Traffic Violations by Sex and Race
We filtered the dataset for moving traffic violations and analyzed for racial biases and disparity in policing. The analysis was limited to White, Black, and Hispanic or Latino incidents as they are the 3 most populous groups, making up 56%, 8%, and 28% of the population, respectively, and 92% of the total population, in totality. The below table details the breakdown of the total number of arrests, citations, and warnings by race in 2019.
Table 1: 2019 counts of arrests,citations, and warnings for Austin’s three major racial groups.
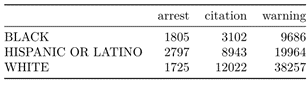
Comparing the total number of incidents, we identified that Black individual related incidents correspond to 15% of incidents; Hispanic or Latino incidents to 32%; and White incidents to 53%. Demographic proportions corresponding to Black individuals within the subsetted population correspond to 8.7% of the population, Hispanic or Latino to 30.4%, and White individuals to 60.9% of the subset population. These numbers suggest a higher incidence rate in Black individuals over White, but this will be examined in depth.
The below is a table detailing the incident counts for arrests, citations, and warnings separated by the sex of the individual involved. Disparity between these classes were analyzed using a Chi-Square test of independence to evaluate associations between race, sex, and outcome of an incident. The results of the test were visualized using the corrplot library within R.
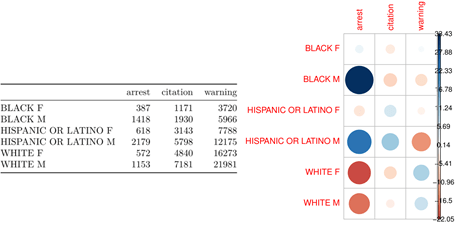
Figure 1: Arrest, citation, and warning counts by race, split by sex (left). Correlations between combine race and sex and incident outcome (right).
The Chi-Square test indicated significant correlation between the combination of race and sex described and the outcome of an incident, with a test statistic of 3280.8 and a p-value less than 2.2e-16. These results are easily visualized within the correlation plot to the right of the race/sex/outcome table above. It is much more likely that Black or Hispanic males get arrested compared to White males or females. Another outcome we can observe is that Hispanic individuals are more likely to receive a citation compared to expected distributions. Finally, White males and females are much more likely to be let off with a warning compared to individuals of other races.
Disparity in Moving Traffic Violations by Sex and Race as a Factor of Time of Day
The Stanford School of Engineering published a study examining police stops across the US between 2011 and 2018 and found that there was a significant difference in racial contributions as a factor of traffic stops in the day compared to the night2. Black individuals, while observed to be more frequently stopped during the day, were much less likely to be stopped at night. These studies show that there is observable implicit or explicit bias regarding drivers pulled over.
We sought to evaluate these features as factors of our datasets as well. We evaluated both the self-reported features of the officer’s knowledge of a person’s race before pulling them over and time of day as a factor of enforcement. We see this examined in the following table, in which counts are displayed for whether or not an officer reports knowing the race before a top, split by time of day in the top right section. Officers reported knowing the race of the person being stopped in 0.8% of stops. While the total number of stops in which the officer knows the race beforehand is low, it was still compared to the stops during the night using a two proportion test. We determined that there were significantly fewer stops in which race was known by the officer before the stop at night (0.4% of stops with a p-value of 1.694e-08). A drop in race recognition as a factor of whether or not a stop occurs may implicate the outcome of a stop in cases of explicit bias.
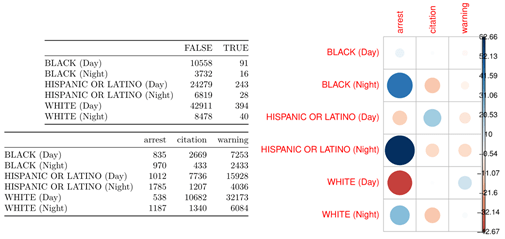
Figure 2: Incident counts of whether or not an officer knew the race of a person before stopping them, split by time of day (top left). Incident outcomes split by race and time of day (bottom left). Correlations between combined race and time of day and outcome of an incident (right)
The correlation plot to the right on the day/night contingency tables demonstrate the clear disparities in race as a factor of incident outcome. Starting with the farthest right column, there are negative correlations between Hispanic or Latino individuals being let off with a warning, regardless of time of day. In the left and center columns, we start to see negative correlations regardless of race in citation and corresponding increase in arrests. Some of the starkest differences are related to probability of arrest, which is highly correlated to night incidents, and is largely independent of race.
We can interpret this a couple different ways. The first of which depends on driver behavior at night. At night, there will be fewer individuals on the road as people will not be travelling to and from work. At night, there may also be higher incidence of DUI/DWI compared to daytime hours. We do not have high enough resolution to further explore this; only the stated reason for the stop. More information, such as stated reason for arrest or stop outside of the context of “moving traffic violation” would be invaluable and is an avenue of data availability worth exploring.
Disparity in Search Rates and Outcomes
We then sought to determine if there was a racial factor to likelihood of getting searched. The left graph in the figure below demonstrates the likelihood of getting searched as a factor of incident outcome. At its face, we see the highest indicator of whether or not a search appears to be incidental to arrest, regardless of race. If we were expecting racial disparity in search rates, this was one area we could find it, with higher correlations between race and searches outside of the context of arrests. Searches as a factor of citations and warnings could be attributed to a “stop and frisk” style of policing that has historically been a direct impact of institutional racial bias3. Instead, there are negative correlations between searches in cases of citations and warnings across all races compared to arrest.
We sought to dissect the reasons for search in the graph to the right. The breakdown of search reasoning may lead to a reexamination of search in reference to outcome as shown on the left.
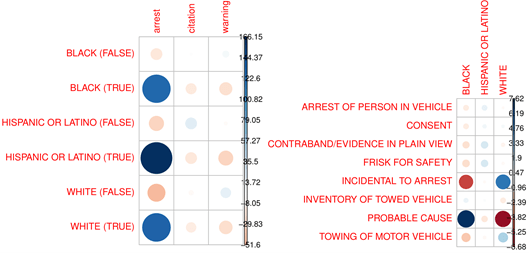
Figure 3: Correlations between search rates and race as a factor of incident outcome (left). Correlations between reason for search and race (right).
There are clear inverse correlations between “INCIDENTAL TO ARREST” and “PROBABLE CAUSE” across Black and White persons. There is a positive correlation between searches as a factor of arrest in White individuals compared to Black and a positive correlation between probable cause as a reason for search in Black individuals compared to White. All other reasons for search across all races appear comparatively negligible. While probable cause is a separate stop reason than a frisk for safety, it may be an example of a pretextual arrest. Kathleen M. O’Day described pretextual arrests in her annotated autobiography as follows:
A pretextual traffic stop involves a police officer stopping a driver for a traffic violation, minor or otherwise, to allow the officer to then investigate a separate and unrelated, suspected criminal offense. Pretextual traffic stops allow police officers wide discretion in whom they choose to stop, and for what reasons they use to justify the traffic stop. By law, police officers must observe a legitimate traffic violation in order to stop an automobile. Police officers, however, have come under fire from individuals who charge that police officers stop their automobiles based on race rather than any supposed traffic violation. (O’ Day 1998)4.
Pretextual arrests, while not defined as stop and frisk, can serve the same purpose and provide a cover for implicit or explicit discrimination. Without a stated reason for probable cause for stop and arrest, we can not discount it due to the inverted correlations between Black and White persons as a reason for search. Recording and presenting the determining factor of probable cause would help alleviate these concerns.
Disparity in Use of Force
In 2019, the APD reported 289 instances of force resulting from traffic stops with the demographic breakdown shown in the table below. These numbers represent a racial distribution for subjects that is 34% Black, 45% Hispanic or Latino, and only 20% White.
Table 2: 2019 counts of traffic stops that resulted in use of force by Austin police.
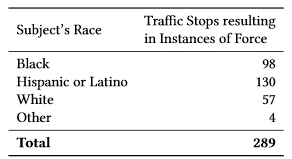
The proportions for each race have been relatively consistent over the past decade, as shown in the figure below, even while the total number of instances of force resulting from traffic stops have more than doubled from 139 in 2010 to 289 in 2019.

Figure 4: Share of force received as result of traffic stops for grouped by subject’s race.
Another metric we used to determine the presence of disparity was calculating the use of force instances per motor vehicle arrest, seen in the table below. This metric is an indication of how forceful the motor vehicle arrests were for a given racial group and was intended to mimic Austin’s strategic measure S.D.3, Number and percentage of use of force in proportion to the number of arrests made. In total, the percent of use-of-force instances per arrest as a result of motor vehicle stops is relatively low at 3.7%. In fact, this is less than half the rate of the reported S.D.3 of 7.8% in 20185. While this indicates that motor vehicle arrests are relatively peaceful across the board, the table below shows that Black individuals experience twice the rate of force in arrests (5.1%) compared to White individuals (2.4%).
Table 3: Instances of force as a proportion of arrests resulting from traffic stops .

Each instance of force recorded by the Austin Police Department has a documented level of force which is each defined by section 211.2 of the Austin Police Department General Orders1. The levels range from Level 1, which includes any use of deadly force, to Level 4, which includes any empty hand control techniques that do not result in any continued complaint of pain or injury by the subject. The table below shows the breakdown of levels of force resulting from traffic stops in 2019.
Table 4: Level of force grouped by subject’s race.
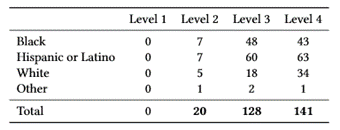
Fortunately, 2019 had 0 cases of Level 1 force, and the vast majority of instances of force resulting from traffic stops (93%) were of the lower levels 3 or 4. While the size of this dataset presents some limitations, the table above suggests that the racial distribution is relatively constant across the levels of force. To extend this analysis, the level of force can be treated as a numerical value to calculate a rough estimate of the “average” level of force that is typically used against each racial group. In 2019, this metric was 3.4 across all races, and similar results of 3.4, 3.4, and 3.5 were obtained for the three major racial groups, Black, Hispanic or Latino, and White, respectively. This analysis of the APD’s documentation of force fails to show a significant disparity of force applied among races, and this trend has been consistent for the past decade, as illustrated in the figure below. In this figure, the recent uptick in level of force between 2018 and 2019 represents a relative decrease in the level of force that the APD are documenting, and it appears that this recent decrease in force has been shared across racial groups.
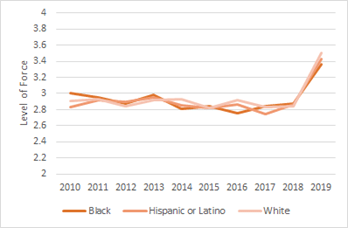
Figure 5: Average level of force used as a result of traffic stops for major racial groups.
We extended this analysis by training a tree-based model using the boosting package, xgboost, to predict the level of force that officers used based on the recorded reason for force, location, and the subject’s recorded race, sex, conduct, and resistance level. This model achieved a training accuracy of 97% and an F-1 score of 75%, and the subsequent importance analysis for the top five predictors of force is displayed in the figure below. The primary predictor of police’s use of force in traffic-related incidents involve actions relating to immobilizing a vehicle in pursuit. Race was not found to be a strong indicator in predicting the level of force police use against a subject, and therefore, this result also fails to identify any disparity between racial groups in the level of force received from police.
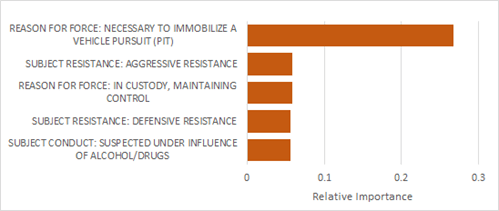
Figure 6: Relative importance in predicting level of force used.
Disparity in Policing as a Factor of Gentrification
Increased police presence as a result of gentrification in a given area is an underrepresented topic of examination in today’s discourse. Housing Matters published a study that examined the intersection of class, race, property value; how these changed over time; and the corresponding police presence in a given neighborhood. They found that for every 5 percent increase in property values, neighborhoods experienced a measurable increase in discretionary arrests that were not found in non-gentrifying areas6. We sought to apply a similar analysis to our work. Using a zip code appreciation report for the Austin area over the past 10 years published by Team Price Real Estate7, we were able to directly map areas experiencing high development to our combined dataset of arrests and warnings.
Similar to the analysis within aim 1, we filtered the dataset to contain only incidents involving White, Black, and Hispanic or Latino individuals. Appreciation rate for property within a given zip code was labelled low if it was under 5%, medium if it was between 5% and 10%, and high if it was 10% or higher. Building off of the analysis within aim 1, the basis of a search was labelled as pretextual if the reason for the search was a frisk-for-safety, probable cause, or consent was granted. We sought to train a model to measure the impact of appreciation increase on pretextual searches, with the hypothesis that there would be a measurable correlation between property value increase and search incidents. We built a Generalized Boosted Regression Model (GBM) within R, leveraging race, sex, APD sector, zip code, time of day, and property appreciation within the area the incident occurred. Below is a plot showing the relative influence of the predictor variables, showing that while the impact of appreciation designation is low (increase_label), zip code had the highest impact on the model.

Figure 7: Feature importance of trained model searching to predict occurrence of pretextual searches.
While it is interesting to see zip code as such a strong signal, ultimately this model performed poorly, with a balanced accuracy of 62.8%. This may be due to several reasons, one of which is that this analysis focused purely on searches. Another way to understand this data could be to leverage the pure number of arrests and warnings as a factor of zip code or property appreciation. As it stands now, this analysis does not support the claim that there is a measurable interaction between property appreciation rate and the likelihood of pretextual searches.
Conclusions
There is no single metric that adequately defines fairness. In our analysis, we approached the problem of fairness in traffic enforcement by attempting to identify disparities present in Austin’s publicly available policing datasets through their Open Data Portal website. We first aimed our attention at disparities in traffic arrests, citations, and warnings and found that there were significant correlations between race, sex, and incident outcome. There was a measurable difference between likelihood of arrest if you are a Black or Hispanic or Latino male, as well as a measurable correlation with being let off with a warning if you are White. We also identified significant correlations between arrest and time of day, but we mention that there may be explanatory factors independent from race not captured within the dataset. Our final analysis as part of racial disparity in motor traffic violations involved search reasons as a factor of race. There are stark differences between reasons for searching when it came to White or Black persons, with searches of White individuals occurring as incidental to arrest and searches of Black individuals occurring due to probable cause. We also note above why probable cause can be a hotspot for implicit or explicit bias when it comes to police stops.
We then used the APD’s Response to Resistance dataset to assess disparities in use of force against the major racial groups in Austin. This analysis revealed a distribution that had been stable for decades that consisted of 34% Black, 45% Hispanic or Latino, and only 20% White subjects. Likewise, in finding the instances of force as a proportion of arrests resulting from traffic stops, we demonstrated that, as a group, Black individuals experienced twice the rates of force as White individuals. However, through predictive analysis, we failed to identify any differences in the level of force across race.
Finally, we attempted to assess whether there were any disparities in policing as a consequence of gentrification in Austin zip codes. Building off of the idea of a pretextual arrest introduced in aim 1, we sought to see if there was a measurable correlation between the property value appreciation and the likelihood of pretextual arrest. While we identified some correlations between a given zip code and a pretextual arrest, our final model was not able to predict pretextual arrests as a factor of property value. We suggest some other ways to reapproach this analysis in future works.
Research on the topic Statistical Fairness has received much attention in academia in recent years with the ever-increasing growth of Big Data and the deployment of Machine Learning algorithms in critical decision-making, but there is still much debate and disagreement as to how to define and calculate “fairness”. In particular, Corbett-Davies and Goal dictate in their working paperfrom 2018, The Measure and Mismeasure of Fairness, that many of these measures of fairness require trade-offs and arbitrarily requiring the satisfaction of one popular metric of fairness could ultimately harm the very people it was intended to help8.
Far from the trade-offs of precise definitions of fairness are the statistical limitations of observational data which pose limitations to any analysis of the data used in this report. We want to warn against using simple metrics to conjure the appearance of statistical fairness at the expense of critical examination of the underlying operations of law enforcement. No metric derived from observational data without the adequate controls will be definitive in assessing the fairness (or unfairness) of any program in law enforcement.
Just as multiple metrics can be informative in assessing the fairness of a program, adequate survey responses from the relevant population can also aid in understanding the behavior of law enforcement. The City of Austin administers a community survey to assess city-wide satisfaction with the delivery of major city services, the results of which are available through an online dashboard9. Showing the results from about 1,800 respondents in 2019, each of the three major racial groups in Austin reported being satisfied/very satisfied with the “Enforcement of local traffic laws” at rates between 46.9%-48.2% and dissatisfied/very dissatisfied rates only varied between 22.4%-25.1%. While these satisfaction rates certainly have room for improvement, the variation between racial groups is negligible. Expanding the questions asked within these community surveys might be an accessible way to gauge potential disparities in law enforcement even before these disparities appear in the published data.
References
- Lexipol LLC (2019). Austin Police Department General Orders. Austin Police Department. https://www.austintexas.gov/sites/default/files/files/Police/General_Orders.pdf
- Abate, T (2020) Black drivers get pulled over by police less at night when their race is obscured by ‘veil of darkness,’ Stanford study finds. Stanford News. https://news.stanford.edu/2020/05/05/veil-darkness-reduces-racial-bias-traffic-stops/
- Gelman et al. (2007) An Analysis of the New York City Police Department’s “Stop-and-Frisk” Policy in the Context of Claims of Racial Bias. Journal of the American Statistical Association. https://www.tandfonline.com/doi/abs/10.1198/016214506000001040
- O’Day, K. (1998) Pretextual Traffic Stops. Injustice for Minority Drivers. Annotated Bibliography. https://academic.udayton.edu/race/03justice/s98oday.htm
- Johns, S. (2020) S.D.3_Number and percentage of use of force incidents in proportion to the number of arrests made. Data.austintexas.gov: the official City of Austin open data portal. https://data.austintexas.gov/dataset/S-D-3_Number-and-percentage-of-use-of-force-incide/u3g7-d5u6
- Beck, B. (2020) As Neighborhoods Gentrify, Police Presence Increases. Housing Matters. https://housingmatters.urban.org/research-summary/neighborhoods-gentrify-police-presence-increases
- Zip Code (Average Annual Appreciation over 10 years). Team Price Real Estate. http://www.teamprice.com/zip-code-appreciation-report.php
- Corbett-Davies, S. Goel S. (2018) The Measure and Mismeasure of Fairness: A Critical Review of Fair Machine Learning. arXiv. https://5harad.com/papers/fair-ml.pdf
- Author Unknown (2021) Percentage of people who agree they were treated fairly during our enforcement and judicial processes. Data.austintexas.gov: the official City of Austin open data portal. https://data.austintexas.gov/stories/s/su8r-wr2c
