Serendipitously, I recently found myself signing up to volunteer for the Dutch climate change non-profit, Justdiggit. I’ll be helping out with the team that focuses on farmer management practices to improve tree cover on and around farmland in central Tanzania. These programs focus on teaching farmers the benefits of having trees on their land as well as the tools and techniques to naturally restore native tree cover. Given my past experience applying deep learning to satellite imagery, I’ve volunteered to deploy and evaluate a deep learning model that tracks the impact of Justdiggit’s programs in Tanzania using aerial imagery. Specifically, we will start by using deep learning to count the number of trees in 1,300 hectares in central Tanzania to see if the number of trees increases over the past few years of the program.
To get a better understanding of the problem, I read this Nature paper on counting trees from satellite images to anticipate some of the challenges and potential solutions that we might face during this project. The specific conclusion of the paper (that there are more small trees in sub-Saharan Africa than previously estimated) wasn’t as important to me as the Methods that they used to obtain this estimate of the number of trees.
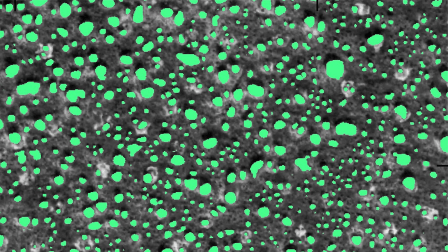
To summarize their approach, they applied deep learning (U-net architecture) to high resolution (0.5 m) proprietary satellite imagery (visible and NIR) to segment images into two classes: tree and not tree. They then fit polygons to these image segmentations and counted the number of polygons of each size to obtain a final tree count stratified by tree size. The image above is a mosaic of some of their predictions. The approach was fairly successful (95% true-positive rate for count and 75% true-positive rate for canopy area), so there’s a lot that I found interesting in the discussion of their method.
Challenges they faced:
- The diversity of soil types and colors affected the performance of the model, and the soil type changed a lot over the large area that they analyzed.
- Bush, grass, and trees are all green and can be difficult to differentiate in satellite imagery, but because bushes and grass are impermanent and don’t provide the ecosystem services that trees do, the researchers had to differentiate trees from other foliage.
- Not all trees look the same. They aren’t all are the same color, size, or shape, and depending on the time of the year, some don’t have leaves.
- Trees might lay on the border of two images, and we don’t want to “double count” any trees.
- Trees are easiest to count when they’re large and separated from one another.
- Some trees are smaller than the resolution of the satellite imagery, so they can’t be detected easily.
- Some trees are too close to each other and difficult to separate visually. Additionally, some trees are so big they look like multiple trees on their own.
Brandt et. al. ’s solution to these challenges:
- Training two models for their two primary geographical regions and then combining the results improved their accuracy. The Sahara model was trained on a subset of about 40% of the training set to target a particularly sandy region in Western Sahara, and the Sahel model was trained on the entire training dataset. Instead of using these models to vote in ensemble, they gave each model a particular region to make predictions.
- They obtained their satellite imagery during the local dry seasons so that grass and small bushes would be brown, while most of the trees stay green. They also had specific criteria for annotating trees in their training dataset: the candidate tree must be bigger than 3 m2, it must have a visible shadow, and the NDVI value must be clearly higher than the surrounding area (i.e. the tree must have leaves). Having clearly documented annotation rules like this is fundamental to creating robust and maintainable machine learning applications.
- They created their training set from a balanced sampling of trees from all the different sub-climates in their area of interest. This included trees of all size and type, including one specific tree that did not have leaves in during the dry season. This tree type was also documented in the annotation notes and annotated as a tree even though it didn’t meet the last of the three criteria.
- They used “test time augmentation” where the prediction is done for 256×256 pixel patches with a 12% overlap of the patches. Then the final predictions were done once the tiles were stitched together. If at least one image in the overlapping regions predicted the pixel to be a tree, that pixel was labeled as a tree in the final prediction.
- This challenge was difficult to overcome and accounts for the largest source of error in their models’ performance.
- The 0.5 m resolution imagery that they used wasn’t able to identify trees that were smaller than 3 m2 (about 1 m in diameter). I suspect that to be accurate in identifying small trees, they would need higher resolution imagery. Drone imagery, for example, can be over a hundred times higher resolution than satellite imagery.
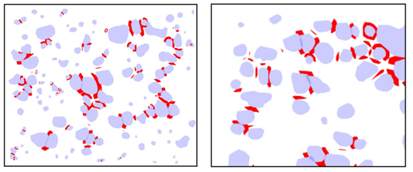
- They used manually annotated penalty regions (shown in red below) for the spaces between trees that were close together, similar to the original u-net paper.
This is just the beginning of this project and I’m sure to learn a lot more along the way. These are just some initial considerations when extracting objects from satellite imagery, and I’m excited to get the opportunity to apply Deep Learning to a real-world dataset through this work with Justdiggit!
